

As a new Gabriola resident, i’m noticing things about my new home — like the marked weather difference between here and Tofino, my previous digs.
Another striking first impression for the visitor or new arrival is the Quinsam, and its central place in island life, and how dealing with the ferry — the oddball departure times; the godsend Ferry Cam; the line-up, with its stringent etiquette and elaborate positioning strategies; the pastimes whiling away the long waits — are all part of island life and lore.
Pretty much everything and everyone on the island come across on that ferry — every coffee cup and bean, every bag of chips, every litre of propane, band-aid and e-bike, along with every customer in every shop. The Quinsam is absolutely intrinsic to island life and economy.
One thing that surprised me is how much of a fossil-fuel orgy the ferry scene seems to be. The race for the line-up, the inching aboard, the 2,601-horsepower rumble of the Quinsam herself, the idling lines of disembarking vehicles … all to the sound and smell of burning fossil fuel. For a visceral sense of it, just grab a few lungfuls of exhaust as you walk or bike up ferry hill alongside a full load of 70 or so eager disembarkees gunning it up the hill.
How big is this essential service’s carbon footprint?
I started wondering about this after my first Sustainable Gabriola meeting, in which several folks expressed their concern about our ongoing, escalating, seemingly unstoppable climate crisis. How much of a carbon load does our ferry represent? And how much of it i should be taking responsibility for?
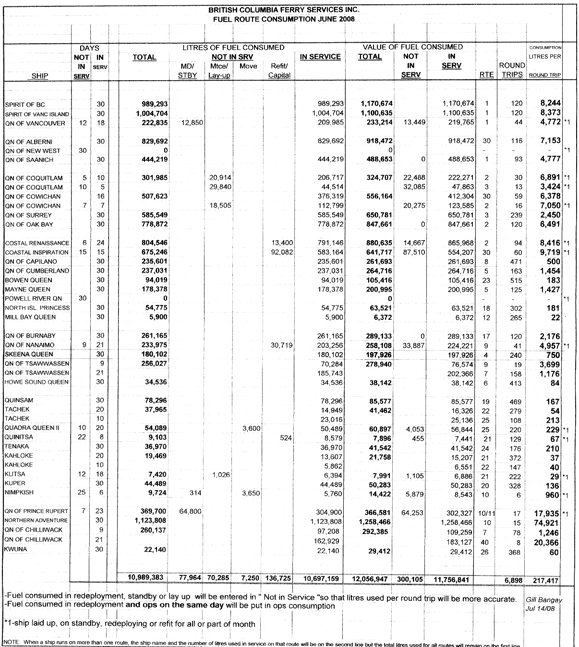 I thought an answer would be elusive, but a quick search on DuckDuckGo (it doesn’t track you like Google) pops up a 2008 blogpost in The Tyee [“BC Ferries’ fuel records show how much new vessels guzzle”] that links to a fuel consumption table for the entire fleet in June 2008 [pic right, click to enlarge].
Math!
The Quinsam row shows that, in 30 days of service in June 2008, she made 469 round trips (an average of 15.6 per day), and used a total of 78,296 litres of fuel (which averages to 167 litres per round trip).
Assuming June 2008 was an representative month (possibly not the case in winter), this gives an annual consumption of 939,552 litres per year of “ultra low sulphur diesel,” as used by all BC Ferries vessels [source] except the LNG ones.
Now, burning a single litre of diesel emits about 2.66 kg of CO2 (carbon dioxide, the main greenhouse gas) [Natural Resources Canada, PFD 2pp].
So the Quinsam emits 2.66 × 939,552 = 2,499,208 kg, or let’s say about 2,500 tonnes of CO2 per year … all to get us and our visitors, groceries and merch on and off the island. Yowza!
How to apportion this carbon responsibility is an interesting question.
Arguably, one could say it’s a part of the provincial transportation system, and should just be folded into BC’s societalcarbon footprint.
Also arguably, one could say that choosing to live on an island gives one a certain responsibility for the inevitable impacts of that choice.
A full accounting would involve totting up the number of trips people take each year — resident, tourist, business traveller alike — and apportioning the climate responsibility accordingly. You’d have to factor in the relative impact (walk-on vs drive-on, small car vs large). And you’d have a simple but unwieldy accounting project on your hands.
On the other hand, given the intrinsic necessity of the ferry to the life and livelihood of every single island resident, one could justly argue that we should all share the ferry’s climate burden equally.
That’s way easier to calculate, so here goes:
More math!
Based on Gabriola’s 2016 census population of 4,033 [StatsCan], our individual ferry-carbon footprint would be 2,500 ÷ 4,033 = 0.62 tonnes per resident, per year. That much CO2 would be emitted driving a 2014 Toyota Corolla about 4,400 km [source], or one return economy-class flight from Nanaimo to Winnipeg [source].
To offset this amount at $20/tonne (e.g. at offsetters.ca) would cost each of us $12.40 a year — or $50,000 a year for the whole 2,500 tonnes.
According to some sources, humanity’s individual sustainable carbon budget is 2.7 tonnes (3 tons) per person, per year — the amount our oceans and biosphere can safely absorb. Global average emission is now 4 tonnes (4.5 tons) per person, per year. Here in Canada we average 22 tonnes per person per year, highest of all the G20 nations [source]. Ouch!
Note that in the bigger scheme of things, the Quinsam is but a drop in the ferry-fuel bucket. Its 78,296 litres was a mere 0.7% of the 10,989,383 litres the whole BC Ferries system consumed in June 2008.
Also note that these figures are from 2008, so fuel economy may be better these days.
And note, finally, that this calculation is the footprint of just the Quinsam — it doesn’t take into account our own individual vehicle use, or the embedded carbon from manufacture and transport that comes with every single thing we bring across to the island.
Climate … it’s a complicated, wicked problem. And it’s another wrinkle to think about in my new island home.
* * *
Banner shot of MV Quinsam by Kam Abbott, of Nanaimo, posted on Wikimedia Commons.

Welcome to the island.. And suck it up buttercup
Well, that comment took great thought!!
Soon we will have 2 ferries.
A well thought out analysis study of our situation and thought provoking in terms of environmental impact, personal responsibility and sustainability. Thank you for writing this from a fellow Gabriolan
noble! Famous YouTuber’s Documentary Sparks Change 2025 tremendous